
Key Takeaways
- Great sales dashboards give go-to-market (GTM) leaders the power to see what’s really driving growth. When data turns into direction, you’re not just watching numbers. You’re also steering the ship straight toward smarter, faster, and more predictable wins.
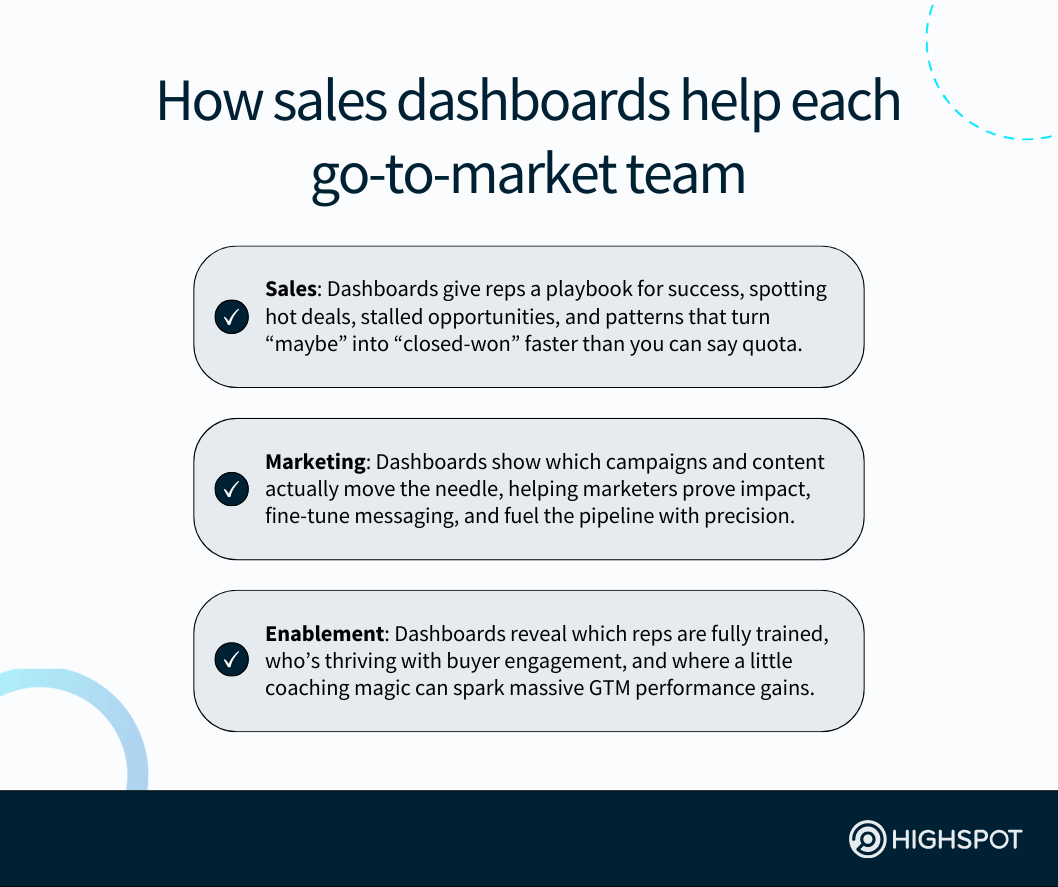
- When your sales representatives see how their daily actions influence deal decisions, motivation and morale skyrockets. Dashboards make performance feel personal, turning abstract data into “aha” moments that inspire sharper selling and bigger wins.
- Understanding your entire sales team’s performance requires storytelling with data. Dashboards transform everyday numbers into narratives that spotlight heroes, expose hurdles, and keep everyone in GTM hustling in harmony toward the next big close.
If you’re like most go-to-market leaders today, you need interactive and exhaustive sales dashboards that cut through the clutter, connect the dots, and help you win.
Whether you’re scaling a team of BDRs or simply aiming to tighten your sales reps’ focus, the ideal sales dashboard setup should give you an at-a-glance view of what’s happening now and what happened when it mattered most so you can drive greater sales productivity and elevate your team’s performance.
Of course, the goal is to monitor your sales team’s performance without playing data detective. Think of rich sales analytics visualized in a compelling dashboard that as your means to glean valuable insights across pipeline stages, rep activities, buyer behavior, and forecast accuracy—all in one place.
This isn’t just about keeping tabs. It’s about sharpening your edge.
The best sales dashboards surface real-time data and highlight how much revenue is in play, what’s at risk, and where to focus, factoring in all data sources in your tech ecosystem.
More to the point, they inform smarter, faster, data-driven decision-making with each of your GTM functions and activities so you can stop reacting and start anticipating.
What is a sales dashboard?
A sales dashboard is a visual reporting tool that helps sales and revenue leaders monitor go-to-market performance and make data-driven decisions across their teams. It consolidates key performance indicators (KPIs) and sales performance metrics into a unified view, making it easy to track actions and results.
A sales dashboard is designed to surface actionable data so GTM leaders can easily track pipeline health, rep activity, buyer engagement, and strategic initiative impact and make informed decisions to empower their sales organizations.
By providing real-time visibility into what’s working and what’s not, it supports faster decisions and smarter prioritization grounded in data-driven insights.
The most effective sales dashboards translate raw numbers into meaningful signals that help sales managers improve coaching, marketing teams enhance their content, and enablement personnel adjust their sales plays and playbooks.
| Value of sales dashboards | Why it matters |
| Real-time visibility into reps’ sales performance | With live dashboards, sales managers can instantly assess progress toward goals. Real-time views keep everyone focused and informed on performance trends. |
| Clear understanding of important sales metrics | Dashboards reveal which numbers actually drive growth and consistency. Sales managers can identify high-impact KPIs and track them over time. |
| Improved decision-making with accurate sales data | Accurate sales reporting ensures your calls are grounded in facts, not assumptions. It gives leaders confidence to act quickly and decisively. |
| Full transparency across the entire sales team | Every rep sees where they stand, creating healthy accountability. Shared visibility builds alignment and strengthens collaboration across roles. |
| More granular tracking of specific sales activities | Sales dashboards make it easy to pinpoint productive behaviors. You can identify what actions most influence conversion and replicate them. |
| Streamlined management of sales pipeline dashboard | Simplify pipeline reviews with clean, dynamic visualizations. They show stalled deals, potential risks, and new opportunities at a glance. |
| Deeper understanding of active sales opportunities | Sales dashboards connect buyer engagement, deal health, and follow-up timing. This helps sales reps prioritize where to focus their next move. |
| Ability to visualize your sales analytics instantly | Interactive reports translate data into insight fast. They let you see patterns, forecast trends, and make smarter enablement and GTM decisions. |
Why sales dashboards are essential to long-term go-to-market success
Forrester VP, Principal Analyst Ian Bruce recently indicated how “B2B companies that fail to fix brand measurement will continue to misallocate resources, misjudge performance, and miss out on growth opportunities.”
And he’s right.
Robust, real-time analytics is the cornerstone of any successful business strategy today.
But it’s not enough for your sales operations team to simply onboard data-driven tools.
You and all other GTM leaders must also build bespoke sales dashboards in these solutions—or, ideally, in a single, centralized solution—that offer always-up-to-date insights regarding your day-to-day sales process and annual sales goals.
The trick to developing dynamically updated sales dashboards that offer valuable insights for your go-to-market teams, though, is to ensure your data is clean.
“By now, most companies know—on an intellectual level at least—that good data is essential to efficient operations, sound decision-making, and powerful AI,” Harvard Business Review contributors Thomas C. Redman and Donna L. Burbank recently wrote. “However, they fail to recognize the critical role that people play in the creation of good data.”
It’s simple: Consolidate data from your CRM and other tools into a single source of GTM truth where you can analyze performance metrics with ease, see which active sales opportunities are approaching the finish line, and what deals sellers may need help closing.
Then, use said go-to-market solution to build custom sales dashboards around this data so you can hit critical sales targets—and address your GTM performance gaps.
How ‘great’ sales dashboards helps today’s GTM leaders accelerate growth
Simply put, sales performance dashboards allow GTM leaders like you to easily keep an eye on progress made toward achieving important business and team goals, spot risks early, and allocate resources with precision and purpose.
At a more granular level, the best sales dashboards also provide:
Clarity across marketing and sales operations
A great sales dashboard acts like night vision for your GTM efforts. It cuts through the clutter so you can actually see what’s happening across every team.
With the right view, all sales leaders at your business can see how campaigns, conversations, and conversions connect to one another in real-time.
By blending CRM data points with data from other tools in your sales tech stack, including your GTM enablement and engagement platforms, you can better understand which sales reps are driving the biggest impact and influencing revenue.
Simplified tracking of business-critical sales goals
Tracking your sales team’s performance shouldn’t feel like wrangling spreadsheets in the dark. Modern sales dashboards bring your GTM numbers to life, surfacing key metrics that show progress toward sales quota attainment, pipeline health, and deal velocity.
In turn, you become far more capable of adjusting your strategic planning as needed.
The best part of being able to conduct this deeper analysis from an interactive dashboard with consolidated data is you can compare both total revenue generated and forecasted revenue in one, clean view, not seven different sales tools.
These insights tied to your sales KPIs can eliminate guesswork, help you make data-backed changes to your sales strategies, and fuel sustainable business growth.
Visibility into progress of strategic GTM initiatives
Sales dashboards act as an easy-to-parse internal portal that lets you zoom out on your go-to-market motion and instantly spot what’s landing and lagging.
- Wondering which play, region, or campaign deserves the spotlight? Your sales dashboard gives you the receipts so you get a quick yet comprehensive understanding of what hits the mark and what doesn’t so you can adapt accordingly.
- Curious which active sales opportunities in your pipeline are at risk of falling out of the B2B sales funnel altogether? An effective sales dashboard can help you see what’s slowing and stalling deals and content that is and isn’t engaging buyers.
What’s great is you don’t have to manually inspect these data points to glean these insights.
Rather, the best go-to-market tools with built-in sales intelligence capabilities can automate most (if not all) of your sales reporting needs. That means you get notified in real-time when deals advance and close and when new issues arise with your GTM efforts.
Actionable insights to inform coaching and training
The trickle-down effect of this view is that it not only leads to better sales forecasting for GTM leaders such as yourself, but also the ability to better equip, guide, train, and coach your sales reps so they continually strengthen their output.
“With the capabilities to align reps to expected behaviors and the analytics to evaluate how sellers actually do so, building predictability into your process is no longer a nebulous, impossible-to-prove effort,” per Highspot’s Science Behind a Predictable Sales Process guide.
Put another way: Sales dashboards aren’t just for execs.
They’re goldmines for managers. When you can visualize patterns in your sales team’s performance, you’ll know exactly where to double down or course-correct.
Use dashboard-derived insights to tailor coaching sessions, refresh training, and empower reps to perform like pros (and even foster healthy competition).
10 sales dashboard examples
The value of sales dashboards is evident.
Now, let’s cover specific examples of dashboards that can visualize your sales data and help you make savvier, data-driven decisions related to your company’s sales strategy.
1. Sales manager dashboard
For sales managers juggling targets and team dynamics, this view is pure gold. It captures key metrics like pipeline health, win rates, and conversion ratios, all in one snapshot.
The dashboard offers actionable insights to guide coaching, optimize coverage, and improve your sales process. Perfect for spotting trends, celebrating wins, and ensuring everyone’s hitting stride toward total revenue growth.
2. Sales activity dashboard
Think of this as your team’s daily pulse check. It helps sales leaders easily track your lead conversion rate, calls made, emails sent, and demos booked.
If you have multiple sales teams across different regions and territories, you can instantly see which group’s firing on all cylinders and discover what’s helping them succeed.
This keeps activity visible, consistent, and tied directly to meaningful business outcomes.
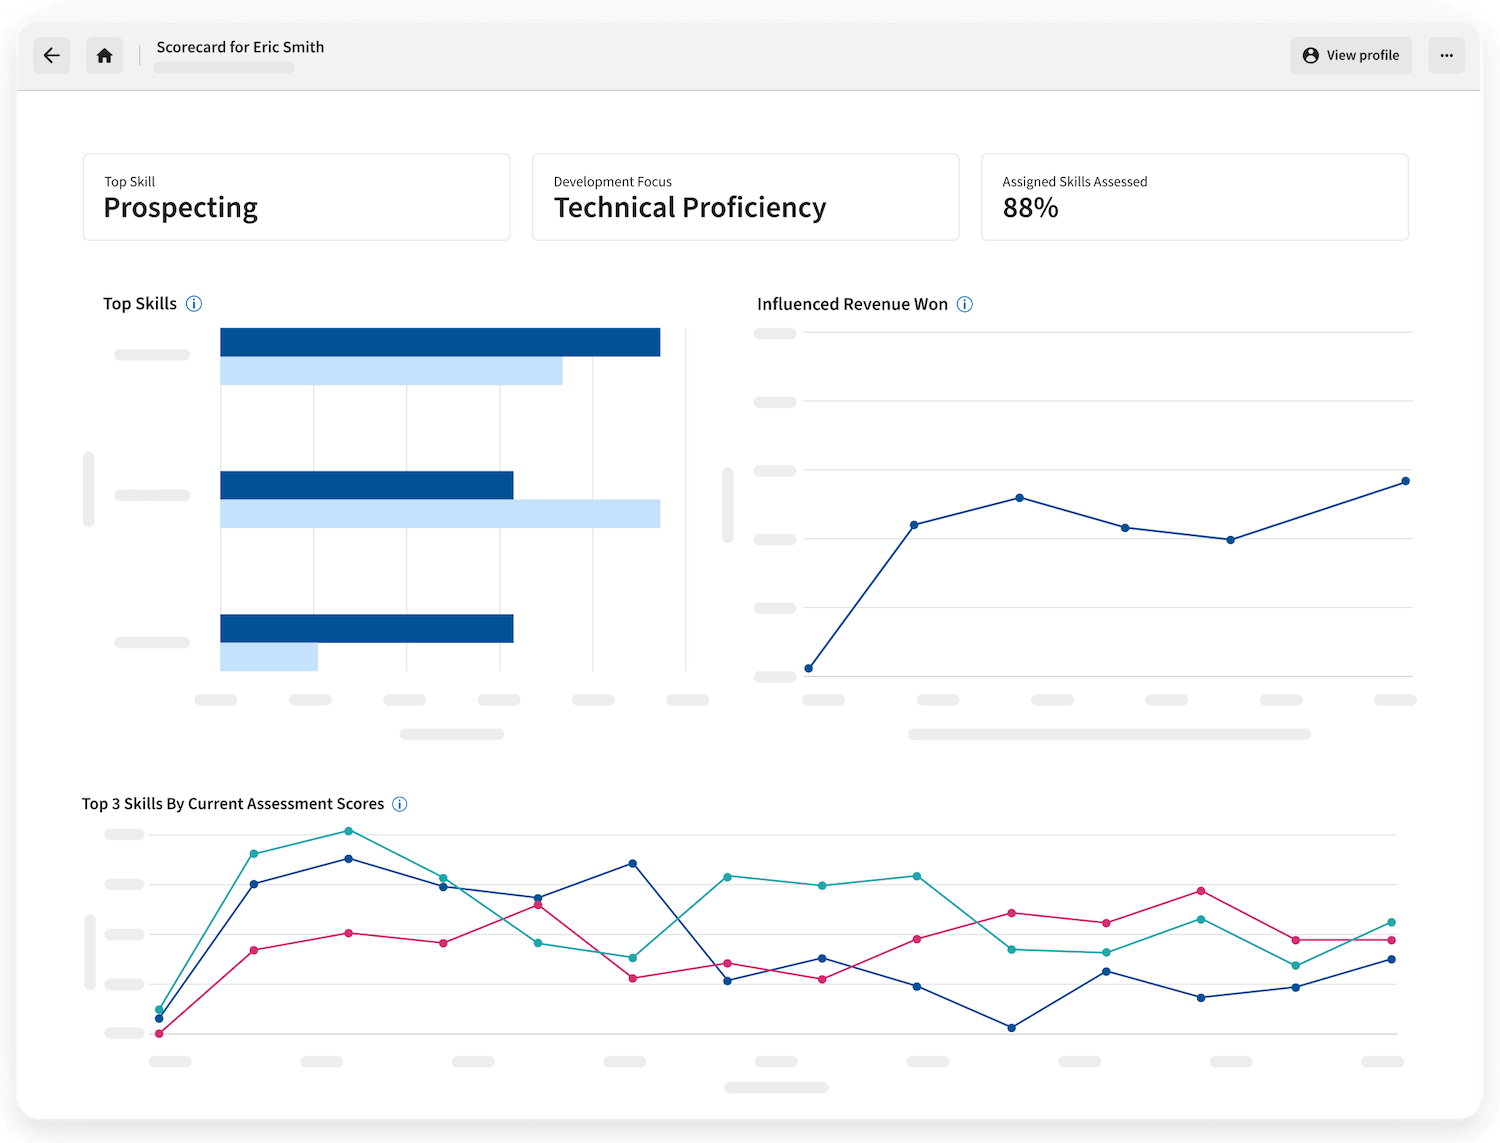
With sales rep scorecards in Highspot, for instance, you can combine content usage, training progress, and buyer engagement data into one unified picture of effectiveness.
Thanks to this clear visibility, each of your sellers and managers can pinpoint strengths, close skill gaps, adjust on the fly, and accelerate performance together.
3. Sales competition dashboard
Turn motivation into momentum with a sales leaderboard to see who’s crushing quota. Sales metrics like deals closed, meetings booked, and pipeline created show who’s leading the charge—data you can then use to replicate top-performer behaviors across your team.
Each sales representative gets a clear, fun view of where they stand. It sparks friendly competition and fuels continuous revenue generation across the floor.
4. Sales performance dashboard
A bird’s-eye view that connects every dot of your entire sales pipeline.
Compare historical and current sales performance to spot trends, gaps, and emerging rockstars. This dashboard helps in comparing sales across time, products, or territories, driving smarter, data-driven decisions.
It’s the ultimate pulse check for knowing what’s working and what needs attention.
5. Sales enablement dashboard
This one’s built to empower your sales team with clarity and direction. See training completion, content usage, and play adoption side by side with key metrics.
The result? You can tie enablement programs directly to impact, giving you data-backed proof that your coaching drives deals, not just morale.
6. Average deal size dashboard
Your deals tell stories. This dashboard helps decode them.
Track the average deal size by rep, region, or segment to uncover patterns in pricing and performance. Comparing sales across categories reveals which strategies bring the biggest wins. The insights help you refine pricing, forecasting, and coaching for long-term lift.
Many reps now use AI sales agents to help them unearth intricate deal data.
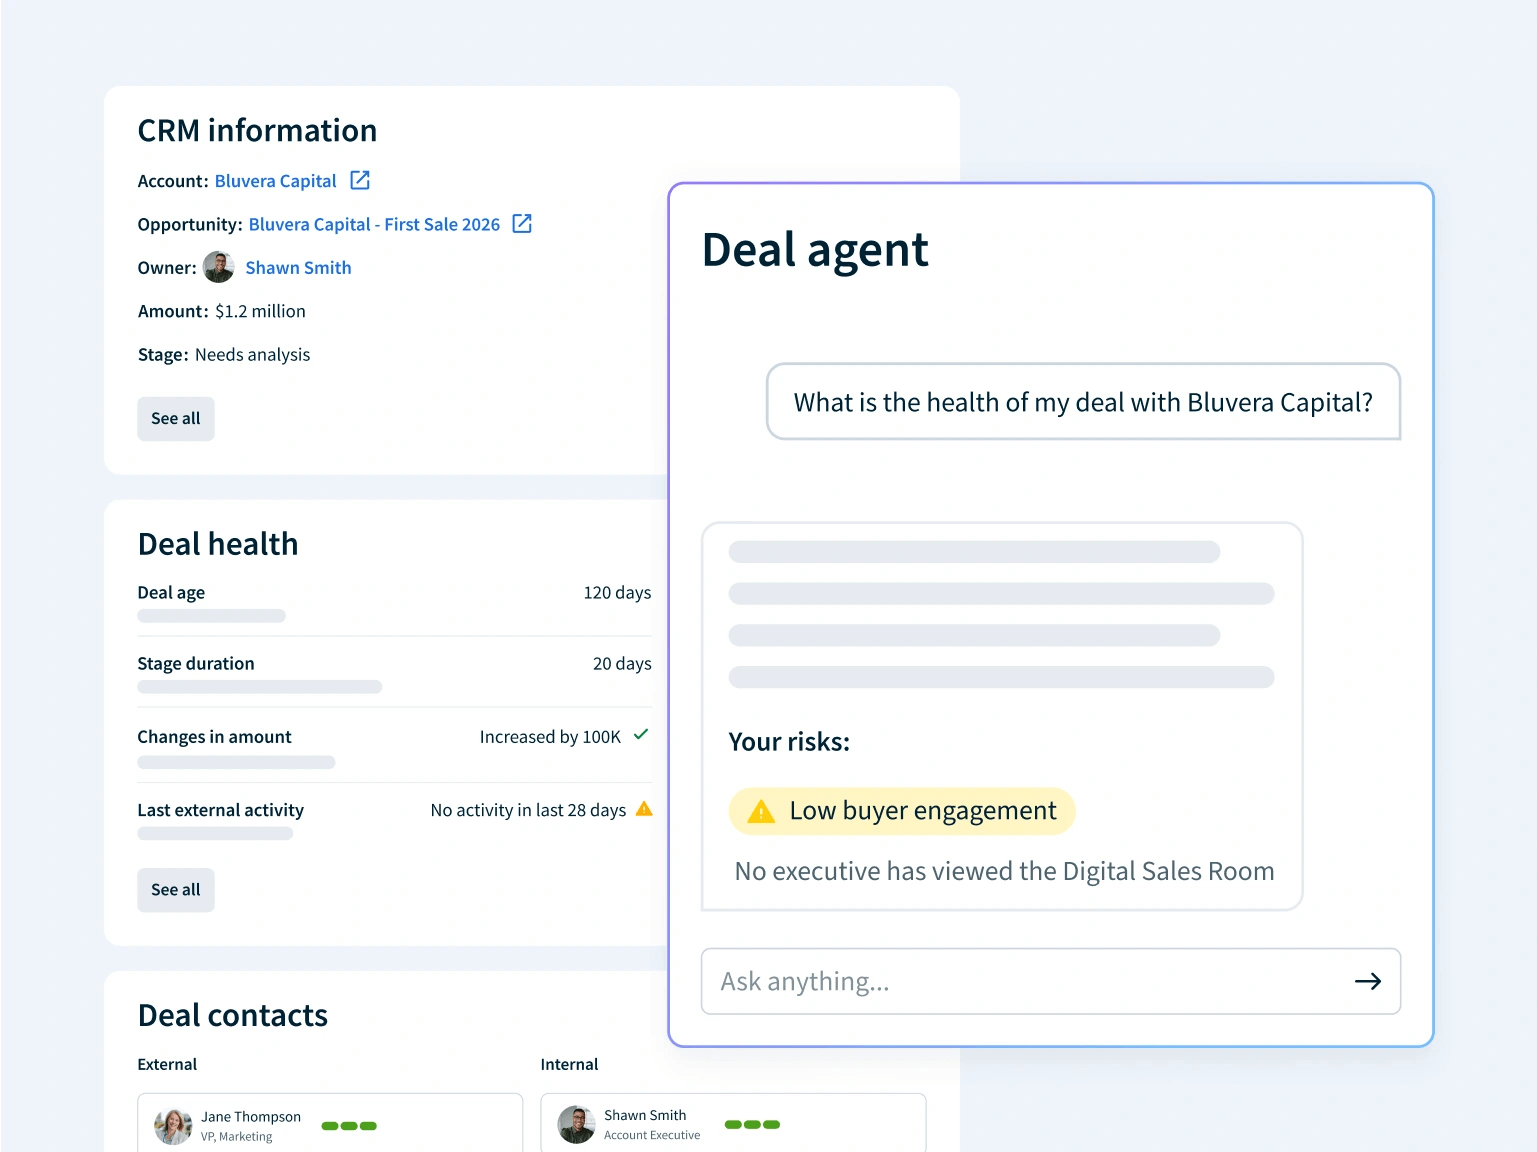
Highspot’s Deal Agent delivers real-time, AI-powered guidance by analyzing deal health, buyer engagement, and activity trends to surface the next best actions for every opportunity.
More specifically, it empowers sellers to focus their energy where it matters most, accelerating sales pipeline movement, strengthening relationships, and improving win rates through informed, precision-driven deal execution.
7. Sales velocity dashboard
Speed matters, and this dashboard keeps your team in the fast lane. Track how quickly leads move from contact to close, highlighting where friction stalls momentum. For instance, spotting delays in follow-ups can instantly inform new plays or process tweaks.
The faster you learn, the faster your team wins.
8. Sales productivity dashboard
Productivity is more than activity. It’s efficiency and consistency. This dashboard measures time spent selling versus admin work and uncovers how reps use their hours.
Sales leaders can identify where sales productivity soars—or sinks—and adjust resourcing accordingly. Think of it as your blueprint for turning effort into outcomes.
9. Customer lifetime value dashboard
Want to win beyond the close? This one’s your secret weapon. It surfaces customer insights as well, like customer retention and churn, upsell rates, and renewal patterns.
By combining these data points, you can predict long-term value, strengthen buyer relationships, and spot risks before they ripple through your revenue.
10. Recurring revenue dashboard
Your growth engine in a single view. This dashboard helps track monthly recurring revenue generation, expansions, and renewals with ease. Monitor total revenue trends, segment by account type, and identify where momentum’s strongest.
With data this clear, you can spot leaks, optimize renewals, and keep compounding growth on repeat, not constantly worry whether you’re behind on business goals.
Making the most of sales performance dashboards to accelerate growth
You’ve got questions. We’ve got answers.
Here are some additional insights that can help you take full advantage of your GTM insights and craft custom dashboards that can shape and sharpen your sales strategy.
What tools can help me build customizable sales dashboards using enablement and CRM data?
Tools like Highspot integrate directly with CRM platforms such as Salesforce, enabling go-to-market leaders to build dynamic, customizable dashboards.
With Highspot, you can pull live deal, activity, and engagement data in real time. Dashboards can be tailored for roles, regions, or product lines. Drag-and-drop configurations make visualization easy for non-technical users.
Highspot turns CRM data into actionable insights your sales, marketing, enablement, and revenue teams can use immediately to adjust their day-to-day tactics, like rep outreach, and big-picture go-to-market strategies.
Can sales dashboards improve forecasting accuracy and help with annual planning?
Yes, sales dashboards can visualize trends across historical and current data for better projections, help you spot pipeline bottlenecks before they derail targets, and highlight core metrics, including deal velocity, win rates, and average close times.
Sales dashboards can also help balance territory performance for planning accuracy, making forecasting more proactive instead of reactive for RevOps.
Which types of sales dashboards give clear visibility into overall sales rep efficiency?
Activity dashboards track calls, meetings, and pitches by rep. Performance dashboards show win rates and quota progress. Productivity dashboards reveal selling versus admin time. Leaderboard dashboards identify top performers instantly.
Together, these views paint a clear picture of sales efficiency and focus and enable you to set and adjust your key performance indicators in a more intelligent manner.
How can I align sales dashboards with company-wide goals and revenue targets?
Start by mapping dashboards to your key business objectives. Use shared KPIs that tie directly to revenue outcomes. Integrate marketing, enablement, and sales data for full GTM alignment. Ensure dashboards update automatically as strategies evolve.
This keeps every go-to-market team focused on shared revenue impact.
What metrics should GTM leaders prioritize when building custom sales dashboards?
Track metrics that show performance and progress across teams and time periods. Include win rate, pipeline coverage, sales cycle length, and conversion ratio to track deal health. Add buyer engagement, content usage, and rep activity rates to see behavioral impact.
Also, be sure to monitor forecast accuracy, sales velocity, and average deal size for financial precision, while layering in stage-by-stage funnel metrics for better visibility into where deals tend to stall and what plays help speed them up.
Compare leading and lagging indicators to predict and validate performance outcomes, and incorporate adoption data from sales enablement and CRM tools to measure process effectiveness and pinpoint opportunities for training and coaching.
These metrics show what drives results, what needs fixing, and where to invest next.
Are there AI-driven dashboards that automate insights and reduce manual reporting?
Yes, some modern go-to-market platforms, like Highspot, have artificial intelligence capabilities that can analyze and interpret sales data automatically for GTM teams and surface emerging patterns, risks, and opportunities in real time.
Highspot’s AI for sales, enablement, and marketing teams also eliminates tedious spreadsheet work, freeing GTM leaders to focus on strategy and execution and giving them faster answers, cleaner visuals, and stronger forecasting accuracy instantly.
With Highspot, revenue operations gets alerts when sales performance metrics drift from targets or benchmarks. The platform’s AI links actions to outcomes, revealing what tactics truly move the needle, while integrations with Salesforce, Microsoft Dynamics 365, and other CRM systems ensure complete, contextual intelligence.